When Ma'am Jing discussed how they applied this HDR to mammogram images, it amazed me. At that same time though, the title of this activity blew me off. It sounded so complicated. A contributing factor was the fact that we're supposed to use it to view plasma(another word that I don't know much), for Kuya Leo's Lab work. As a result, I ignored it. I thought I could get away from this activity. But noohh...
It can't be helped. I have to do it. When I was doing it, I realized the activity was easier than I first thought and imagined.
The goals for this activity are to:
1. solve for the response function g(Z) of a camera using the steps outlined in the paper of Devebec and Malik 97 and
2. render a high dynamic range image of the picture by solving for the irradiance given g(Z), the shutter speed for each image, and pixel value.
METHODS
In attaining the first goal, I just followed the steps in the abovementioned paper, as follows.
1. I took pictures of the plasma in Plasma Physics Laboratory of National Institute of Physics Philippines (thanks for the permission) for varrying shutter speeds. The camera was set so that there must not be any lateral movement when taking the pictures.
2. Next, I picked 5 points for each of the images taken. Note again that each image corresponds to one shutter speed (as these were taken at different speeds).
3. The plot for ln(shutter speed) against gray level values (Z) is obtained. And using the least square method outlined in the abovementioned paper, the g(Z) response function og the camera is obtained.
RESULTS
Shown in the figure are the images that we were able to take from Plasma Lab and the corresponding shutter speeds used for our camera.
 Figure 1. The input images used.
 Table 1. The corresponding shutter speeds used in capturing the images in Figure 1.
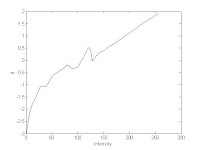
After getting this plot, a fit is obtained through the method and Matlab code mentioned in the paper of Devebec and Malik 97. In their work, they used the method of least squares. Shown in the following figure is the response function of the camera, g(Z).
The first of the two goals is now obtained. The next step is now to render a high dynamic range image of the picture by solving for the irradiance from the given values. I'm still thinking how to render an image using the irradiance here...
To be continued....


No comments:
Post a Comment